Engineering Drawing Symbols

Before you embark on your educational journey, learn more about Vista Projects and our integrated engineering teams…

Welcome to our engineering drawing symbols hub. This is the place to learn about engineering symbology, different types of drawings and documents, and how to use modern technology to simplify collaboration.

There are literally hundreds of engineering drawing symbols and they’re used in a variety of ways. For example, engineering symbols are used in technical drawings to convey the specific geometry and other details about pieces of equipment or components.

To limit errors caused by personal interpretation, engineering drawings and diagrams are governed by standardized language and symbols.

Technical engineering documents like piping and instrumentation diagrams (P&IDs) or process flow diagrams (PFDs) consist of pictographic representations, abbreviations, and symbols. Sometimes additional textual explanations are included to convey the required details.

Check out our library to learn more about P&ID symbols and PFD symbols.

Jennifer Gray
Engineering Director

Symbology Library

363 Common P&ID Symbols: An Engineer’s Library

Our collection of common P&ID symbols will help you better understand the piping & instrumentation diagrams on any engineering project.

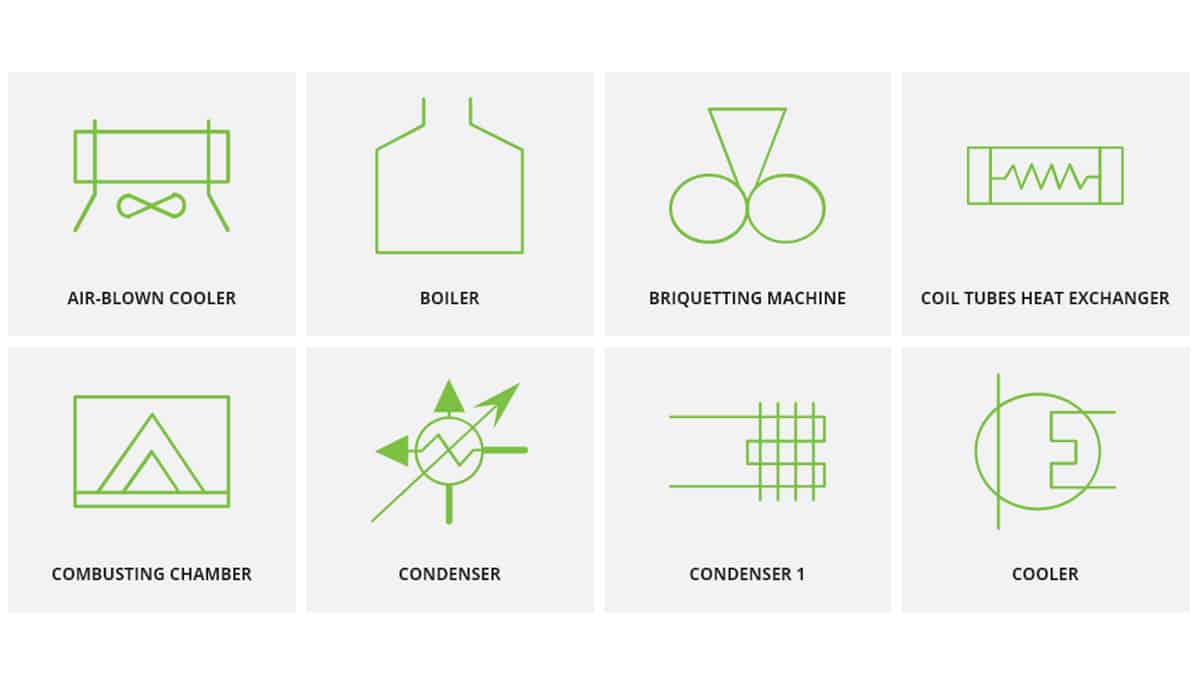
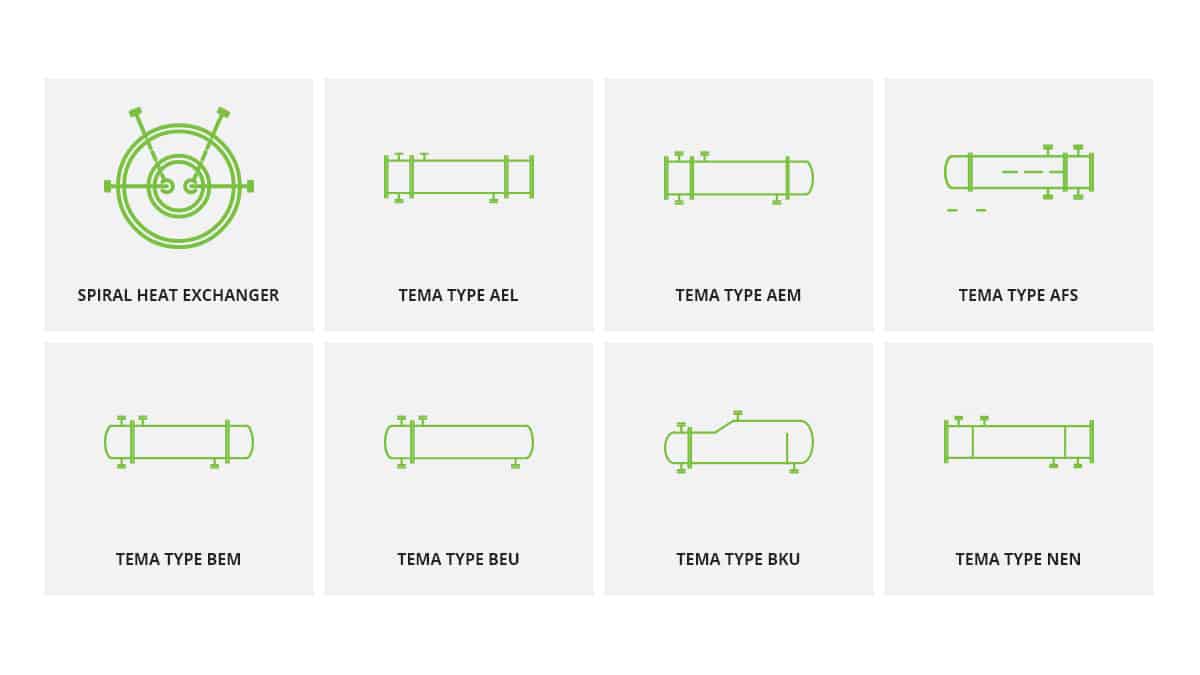
181 Process Flow Diagram (PFD) Symbols for Engineers

Our Process Flow Diagram Symbols List will help you better understand the PFD symbology on any engineering project. Check it out today!

FAQ - Engineering Drawing Symbols

How to Read Engineering Drawing Symbols?
Engineering drawing symbols are simple to pick up and use once you understand how to read them. Unlike a model, engineering drawings note much more specific information and requirements, such as:
  • Dimensions
  • Tolerances
  • Finish
  • Geometry
  • Hardware
  • Material type
In engineering services, 3D models are often used in conjunction with drawings as they are a good working solution offering a visual representation of the system/ product. Individual components on PFDs and P&IDs may have their own engineering drawings to provide more detail for unique parts.
What does P&ID mean?

P&ID is an abbreviation meaning ‘Piping and Instrumentation Diagram.

A Piping and Instrumentation Diagram (Drawing) is a graphical representation of an engineering process system.

They are fundamental to every standardized engineering project, commonly used for the design, installation, and optimization of a system.

These two-dimensional engineering drawings function as a blueprint for the engineering system’s design.

Piping and Instrumentation Diagrams detail the specific processes within an engineering plant or industrial facility.

They use a selection of industry-standard engineering symbology to demonstrate the relationship between the components of a technical engineering drawing.

What are P&ID symbols?

P&IDs use a selection of standardized geometric symbols to highlight the required instruments, equipment, pipe, and interconnecting lines in a system.

Knowing what the various symbols represent is vital to a user understanding a P&ID.

For engineers and designers, knowing the symbology legend can also improve P&ID collaboration.

We recommend using this comprehensive library of common Piping and Instrumentation Diagram drawing symbols to familiarise yourself with common P&ID symbols.

The common P&ID engineering equipment symbols are organized into ten categories:

  1. Atmospheric tanks
  2. Compressors & Blowers
  3. Drivers
  4. Filters
  5. Heat exchangers
  6. Heaters
  7. HVAC
  8. Pumps
  9. Stacks
  10. Vessels
How to Markup a P&ID?

Marking up a P&ID may seem daunting at first; however, once you familiarise yourself with all the components, the process becomes easy and quick to follow.

To see how to markup a P&ID with valve symbols in real-time, follow this video tutorial by Scott Mussbacher, the Systems Integration Lead at Vista Projects.

How to Draw a P&ID?

A piping and instrumentation diagram is drawn up at the design stage of an engineering process to model the system.

It consists of a combination of the process flow datasheet, the mechanical equipment design, and the instrumentation engineering design.

These technical drawings can range in complexity and either be hand-drawn or created using specialty CAD software.

Once the initial P&ID is complete, we like to use Bluebeam Revu for P&ID Markups during online engineering squad checks.

Tools Required

  • A Computer
  • Internet Connection
  • Appropriate Software

Knowledge Required

  • A degree in Process Engineering or Chemical Engineering
  • An understanding of P&ID symbols

Here are 8 steps to draw your own P&ID

  1. Define the scope of the system
  2. Identify the inputs
  3. Identify the outputs
  4. List all the equipment in the process
  5. Define the relationship between components
  6. Piece together your flow
  7. Add detail
  8. Finish and review the process

To find out about these steps in more detail, check out this guide.

What is the Best Software to use for P&IDs?

Several pieces of computer-assisted design (CAD) software are available to create and design P&IDs, ranging in complexity, intuitiveness, and professionalism.

CAD software to consider for P&IDs:

Here at Vista, we are technology agnostic and work with clients to determine the best fit for their project requirements. We are also a certified implementation partner of AVEVA and their P&ID Suite is a great option.

AVEVA P&ID was specifically written for designing P&IDs, and so is incredibly efficient and intuitive to use.

It contains an inbuilt function that eliminates errors through the use of intelligent data – generated using design rules.

Plus – the software itself can be integrated into wider packages, making it easy to share your designs, however basic or detailed they may be.

What Does PFD Mean?

A Process Flow Diagram (drawing) is a flowchart that depicts the relationships between major components in a process or circuit. The concept originated in 1921 – it was designed by industrial engineer Frank Gilbreth.

Today engineers are commonly using the drawings in industrial plants for chemical and process engineering, but the concepts can also be applied to many other engineering applications.

Process flow diagrams consist of a series of drawing symbols and notations to illustrate an engineering process. The different types of flowcharts can vary hugely from hand-drawn flowcharts to complex CAD software flowcharts.

Unlike P&IDs, PFDs detail the system as a whole, indicating a more general flow of the plant process and the relationship between the commonly used equipment of an engineering plant facility.

What are PFDs used for?

Process flow diagrams can document a predefined process, improve an existing process, or model a new process. Process flow diagrams can also be known as:

  • Process Flow Chart (Drawing)
  • Flowsheet
  • Plumbing & Instrumental Diagram (Drawing)
  • Macro Flowchart
  • Top-Down Flowchart
  • Block Flow Diagram
  • Schematic Flow Diagram (Drawing)
  • System Flow Diagram (Drawing)
  • System Diagram (Drawing)
What is included in a PFD?

For a single unit process, the flowchart drawing features:

  • Process piping
  • Commonly seen equipment items
  • Operational data (pressure, temperature, etc.)
  • Major bypass
  • Process stream names

To reduce over-annotating a process flow diagram, some aspects aren’t featured:

  • Pipe classes and line numbers
  • Minor bypass lines
  • Instrumental details
  • Instrumentation
  • Isolation and shut off valves
  • Controllers (such as a flow controller)
  • Maintenance vents and drains
  • Flanges
  • Relief and safety valves
What are PFD Symbols?
Process Flow Diagram symbols use different shapes to represent different components, for example, equipment, valves, instruments, and piping flow. There is a standardized set of geometric symbols used. Common symbols include:
  • Centrifuges
  • Heat exchangers
  • Crushers
  • Dryers
  • General PFD symbols
  • Mixer symbols
  • Peripheral PFD symbols
  • Pipe fittings
For more information on what specific PFD symbols represent – and some examples, follow this link.
How do Engineering Drawings, PFDs, and P&IDs relate?

P&IDs can be used to make up part of a PFD.

A P&ID is used to show the relationship between the types of components in a process.

A PFD indicates a more general flow and shows the relationship between types of equipment or multiple processes. In general, PFDs are far less detailed and show a broader image. P&IDs are far more detailed and depict a single process.

PFDs and P&IDs are both examples of flow diagrams. Flow diagrams have several benefits, including:

  • An easy to understand structure for high-quality control and in-depth training
  • Standardizing of a process for optimal efficiency, repetition, and use
  • To aid the measurement of efficiency and improvement in a process, highlight areas of inefficiency, bottlenecks, and unnecessary steps in a diagram
  • To model a new or improved process
  • To communicate and collaborate on several projects

Related Topics

How to Markup a P&ID Drawing with Valve Symbols in Real-Time

In this remote engineering collaboration demo video, Scott Mussbacher, Systems Integration Lead with Vista Projects, shows how to mark-up a P&ID drawing with valve symbols in real-time.

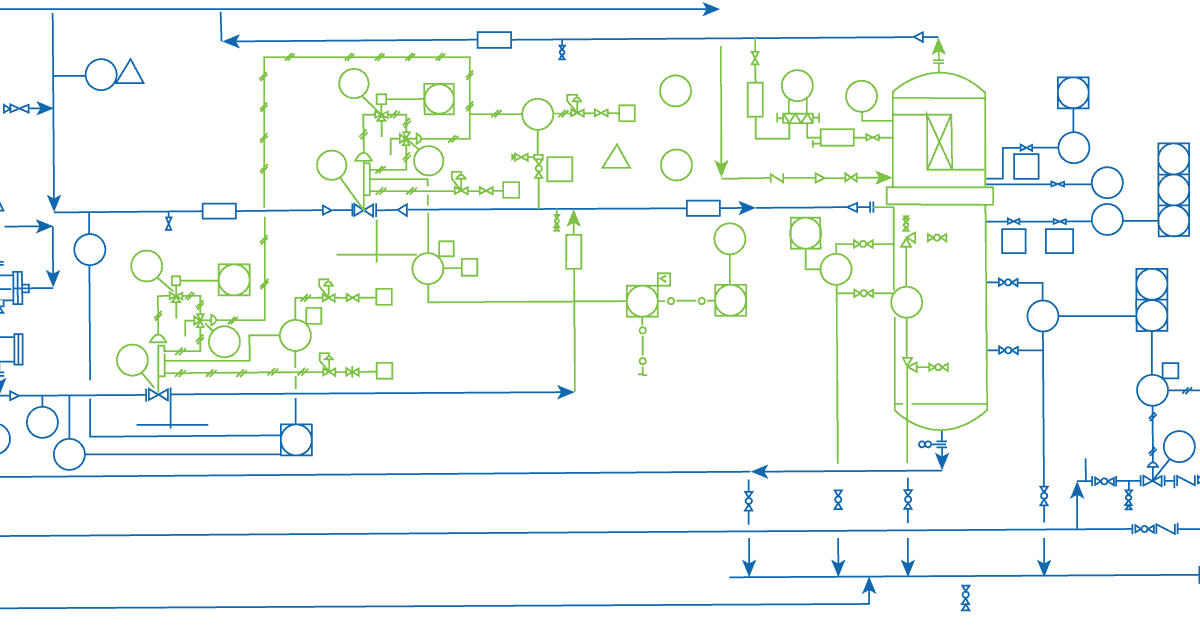
How to Draw a Piping & Instrumentation Diagram (P&ID)

Drawn at the design stage, a P&ID is an important engineering document that shows the interconnection of process equipment and instrumentation to control the design system.

How to Read Engineering Drawing Symbols

In this post, we'll go over the basics of how to read engineering drawing symbols, including the symbology commonly included on P&IDs and PFDs.

Data-centric Execution

Datacentric PDF DL